Free
Your performance, in context.
Time-weighted returns, benchmark overlays, allocation and a closer look at your positions.

Try the controls, hover over the charts and switch between views. These previews use fictional data; your own portfolio stays in the extension.
Time-weighted returns, benchmark overlays, allocation and a closer look at your positions.
Follow changes since refresh with Portfolio Pulse, explore daily contributors and switch between table, waterfall and heatmap views.

Read portfolio observations, then explore correlation, risk and stress tests with Pro.

See received dividends, monthly totals and estimated upcoming payments. Pro adds per-holding breakdowns and export.

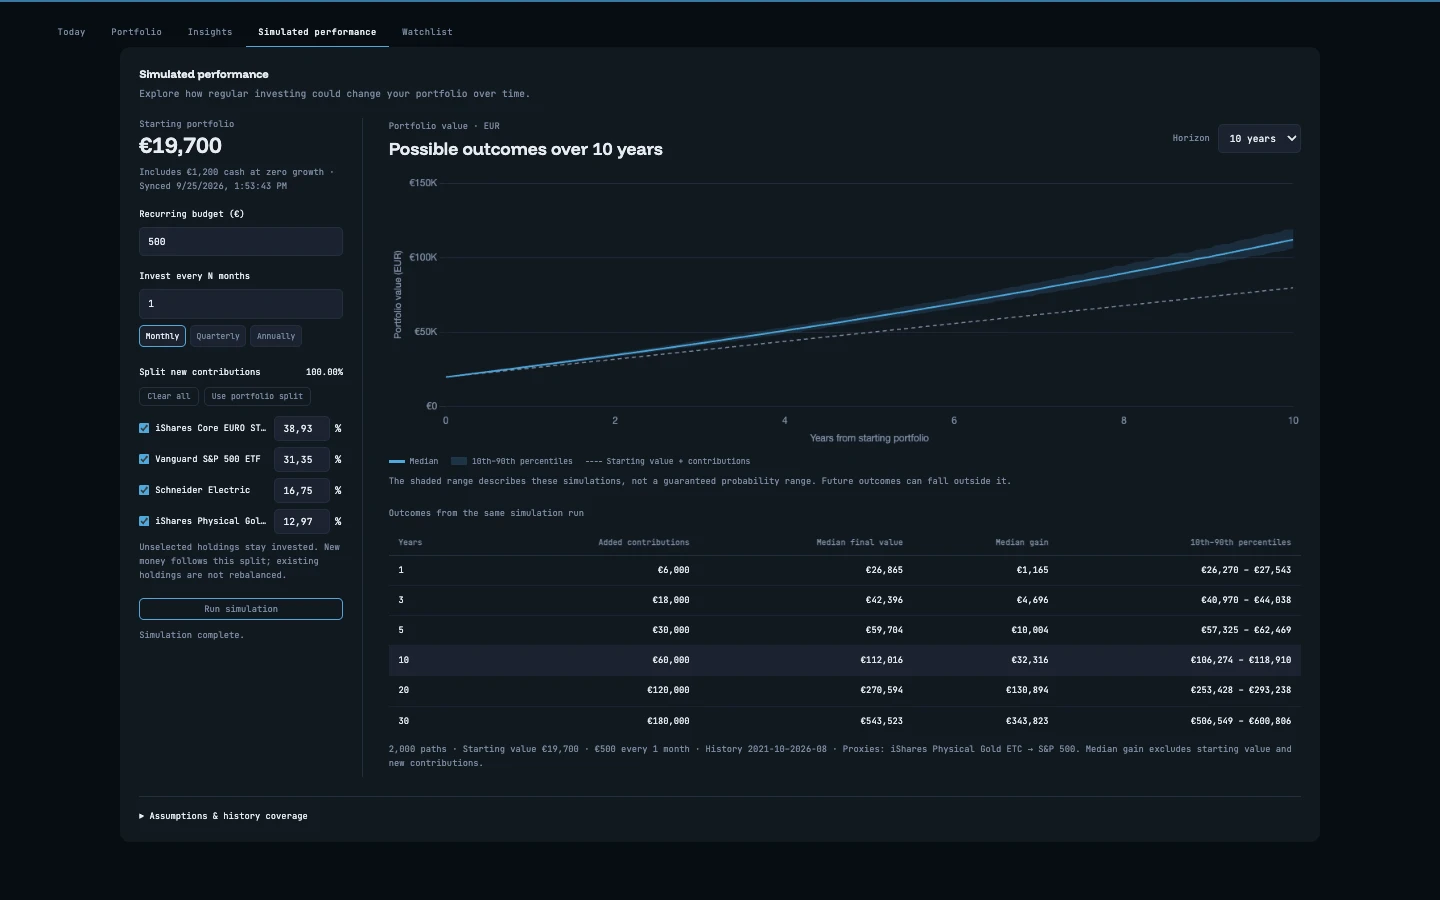
Allocate a recurring budget and explore scenarios derived from historical prices. Simulations are not forecasts or guaranteed returns.
Keep your broker. Get more from your portfolio.
Add to Chrome — free