Free
Your performance, in context.
Time-weighted returns, benchmark overlays, allocation and a closer look at your positions.

Portfolio analytics for DEGIRO
Track your investment returns, compare benchmarks, and understand your dividends and risk—with a Chrome extension built for DEGIRO.

Separate the performance of your investments from the money you add or withdraw.
Put your portfolio alongside the S&P 500, STOXX Europe 600 and Nasdaq 100.
Explore your allocation, dividend income and the positions driving your results.
From the long-term picture to today’s moves, see what Sharpe adds to your DEGIRO account.
Time-weighted returns, benchmark overlays, allocation and a closer look at your positions.
Follow changes since refresh with Portfolio Pulse, explore daily contributors and switch between table, waterfall and heatmap views.

Read portfolio observations, then explore correlation, risk and stress tests with Pro.

See received dividends, monthly totals and estimated upcoming payments. Pro adds per-holding breakdowns and export.

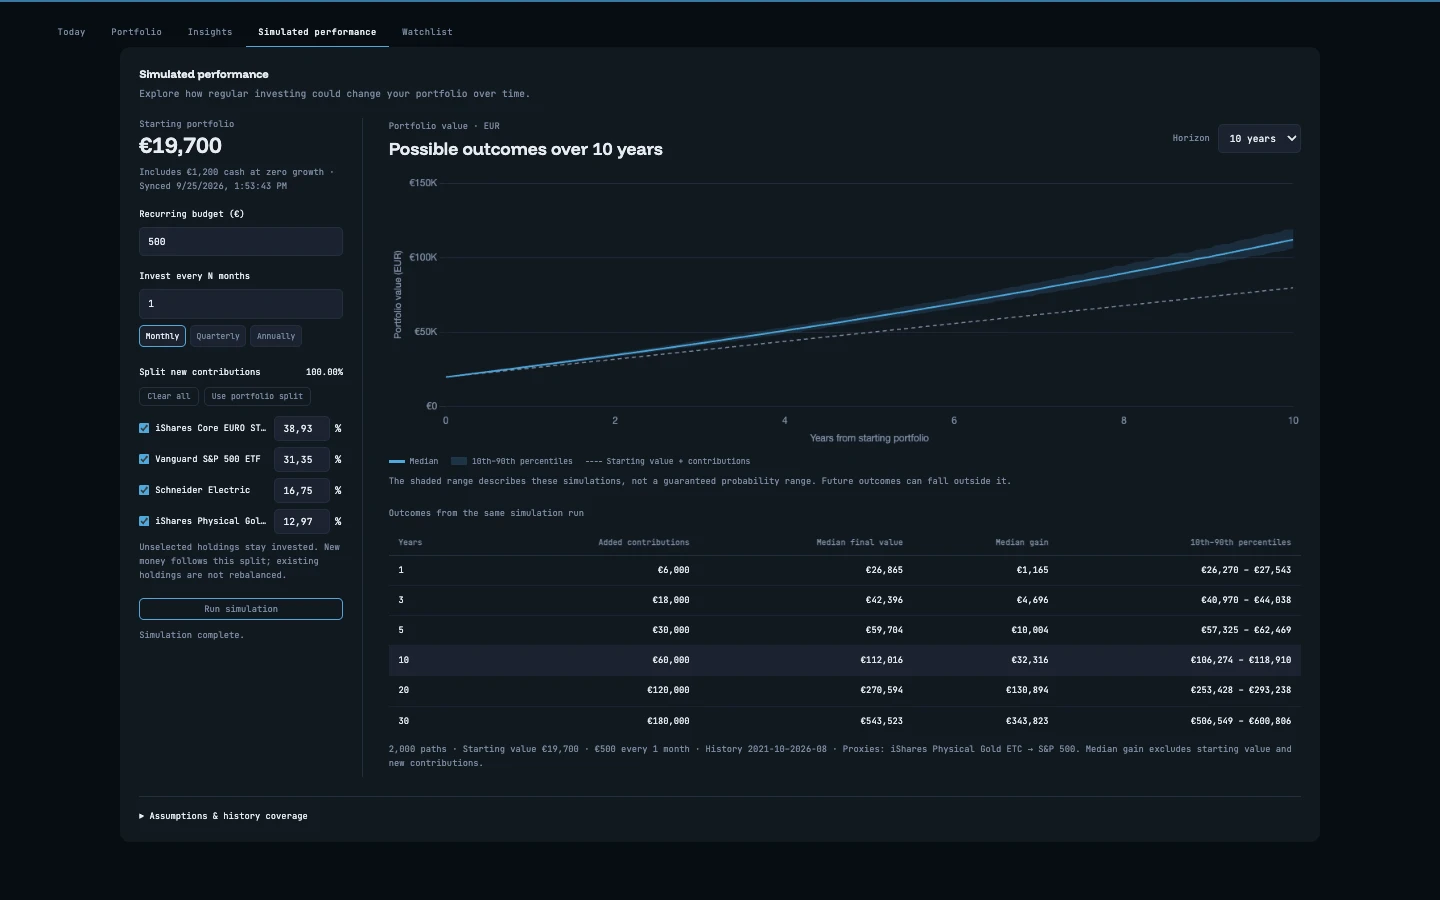
Allocate a recurring budget and explore scenarios derived from historical prices. Simulations are not forecasts or guaranteed returns.
You start with €10,000. Your investments gain 10%, then you add €5,000. Your portfolio is now worth €16,000—but your investment return is still 10%.
Time-weighted return accounts for deposits and withdrawals so you can compare investment performance across periods.
Understand how returns workA simple worked example
Illustration only. Assumes a single end-of-period deposit and no other cash flows, fees or taxes.
Add the extension from the Chrome Web Store on your desktop.
Log in to your account as usual. No separate Sharpe account is needed for the free extension.
Open Sharpe and let the initial sync finish. Your analytics are calculated in your browser.
Keep your broker. Get more from your portfolio.
Add to Chrome — free